When I first started working on consumer base analytics in 2001, I was amused with varieties of analysis and activities you can perform on the customer portfolio.
It was my dream job.
Diving into mass data, finding out meaningful information, converting them to actions and, as a result, increasing the profit of the company was much more than mere job satisfaction.
One of the most interesting models was called, “vintage model” at that time. I think it is not a common industry-specific term. Therefore, I’ll explain in detail with an example case. You don’t need a special tool to implement this model. Excel would be more than enough.
Fictitious case:
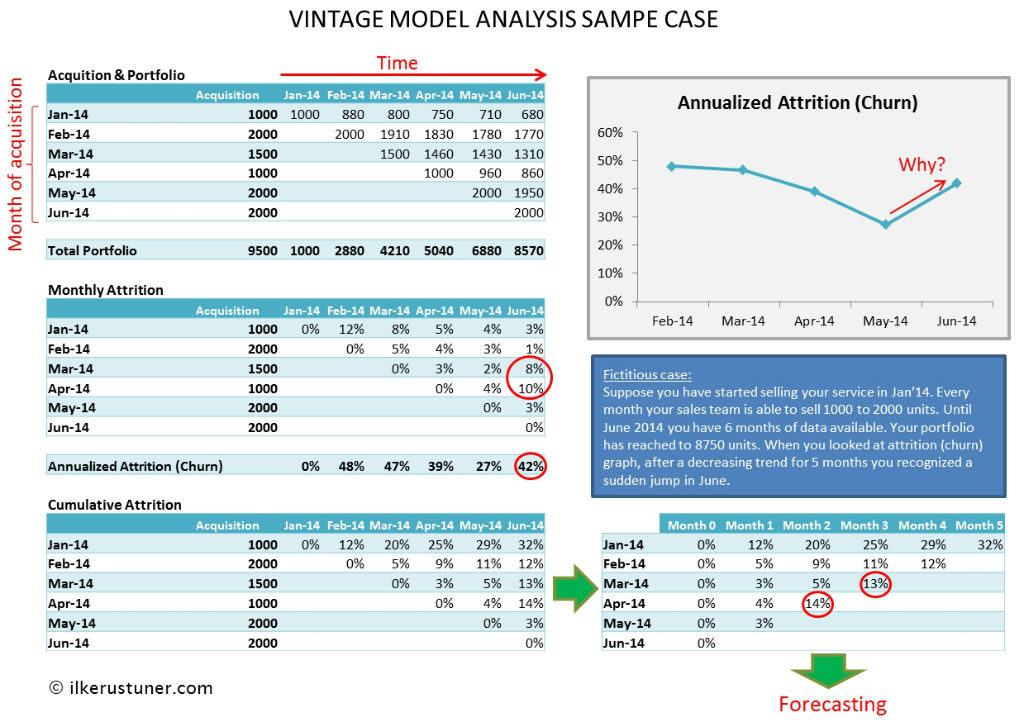
Suppose you have started selling your service in Jan’14. Every month your sales team can sell 1000 to 2000 units. Until June 2014, you have 6 months of data available. Your portfolio has reached to 8750 units. When you looked at the attrition (churn) graph, after a decreasing trend for 5 months you recognized a sudden jump in June. You wonder why?
Preparing Data: Segmentation
The model divides the data based on the vintage/tenor composition. Divide current portfolio into smaller pieces, and each represents a month of acquisition.
For simplicity, you can call the action: segmentation by the tenor.
When you look at the trend of each such piece in a single table, you will recognize a triangle format.
For our case, I’ve created the same tables for monthly attrition and cumulative attrition.
Analysis: Reading Data to understand what’s going on
Vintage models are useful when the reason behind an unexpected loss/drop is associated with the customers acquired in a particular period. This approach mostly used for analysis of early tenor customers.
In practice, many companies already using vintage models through closely monitoring early tenor customers, e.g. clients in their first 3 months.
Using vintage models, it’s possible to analyze further than early tenors.
Maybe customers acquired 15 months ago suddenly closed their services. When you can define the segment of customers with the issue, it is easier to find the root causes and take action.
Who acquired these customers 3 months ago? Maybe a sales point which has moved to a competitor a month ago.
What was sold to those customers different than others? Perhaps a special promotion which turns to attrition at the end of the promotion period.
Understanding what’s going on and why it has happened is good and useful. But the real question to be answered is: how will it continue?
Vintage models’ actual use come into place at projection and planning for the future: forecasting.
Forecasting: Using vintage data to project future
While I was responsible for budgeting and forecasting, almost all of my forecasting models were using vintage based inputs.
I would say expense forecasting is rather easy, but portfolio forecasting needs expertise together with proper methodology.
In the fictitious case, I’ve provided, left justify the cumulative attrition table, and you’ll get same data but easier to use for forecast models.
Now you have the average attrition rate of a 1 month, 2 months, 3 months of customers.
Since you also have an acquisition forecast, you’ll quickly know after 9 months how many customers will be 1 month-old, how many 2 month-old etc.. Apply each one’s attrition rate to particular tenor segment and you’ll correctly forecast how many customers you’ll lose in 9 months from now.
Finetuning: Refresh your vintage models as actual data comes out
Since your model does forecasting heavily based on historical data, you can easily put actual values to your model and validate the accuracy as well as improve it. In fact, any unexpected realization would mostly mean there is something to investigate.
Do not expect a full moon every night. Without analytics, you sail at night without light! Proper analytics should enlighten your front route in priority.


